Last Updated on June 12, 2024 by Ryan Knuppel
Baseball numbers have been around for a long time. Let’s look back at the beginning of numbers in baseball.
In 1845, The New York Morning News had the first box score which included only the batters’ runs and outs. Sportswriter Henry Chadwick posted a box score which included runs, outs, hits, assists and errors in the New York Clipper in 1859. In 1872, Hervie Alden Dobson, a fan, wrote to Chadwick and suggested he include hits to time at-bats. This will lead to the formation of the batting average.
Sportswriter Ferdinand Cole Lane, who writes for the Baseball Magazine, devises his own values for singles, doubles, triples, and home runs in an attempt to overcome the inadequacy of simply using batting averages as a performance indicator in 1911. In 1947, Allen Roth became the first full-time statistician working for a major league team. Roth goes on to calculate on-base percentages, batting averages with runners in scoring positions, performance in ball-strike counts, and more after being hired by GM Branch Rickey of the Brooklyn Dodgers.
Earl Weaver became manager of the Baltimore Orioles in 1968 and he created note cards to track head-to-head match-ups. In 1971, the American Baseball Research was formed in Cooperstown, NY to explore baseball history and statistics. In 1977, Bill James published the first Baseball Abstract and the explosion of sabermetrics began.
Sabermetrics is the newest way to get statistics in baseball. It involves many new and old formulas that are a way to measure a player’s performance. The definition is a combination of the acronym SABR (which is the Society of American Baseball Research) and metrics or measurement. Sometimes it is known as the search for objective knowledge about baseball. The concept was created by Bill James. To understand sabermetrics one must understand the language that has been created.
But what is the official sabermetrics definition according to the dictionary?
the application of statistical analysis to baseball records, especially in order to evaluate and compare the performance of individual players.
Table of Contents
The Foundations of Sabermetrics
We grew up with it and it is ingrained in us. As children growing up it was about batting average and runs batted in. You are saying there is nothing wrong with those. But there is. Let’s dig a bit deeper into these old statistics. Let’s look at how we feel about batting average. If you are a .400 hitter you are elite. Very few except for Ted Williams can be classified into that category.
The .300 hitters are the good hitters. It is said you must be a .300 hitter to get Hall of Fame consideration. The .299 hitter not so much. It is a magic line in what we feel is the quality of a batsman. Batting in the .200 range goes from decent on the higher end to not very good at the lower end. In fact, the word for that low batting average is the Mendoza line. Even though he never hit below .211 in his life.
Batting average is hits divided by at-bats. That’s simple. However, look at these that must be considered. There are ten ways that an at-bat can end. Those are hit,walk, out (with four ways to make an out),sac bunt, sac fly, hit by pitch, defensive interference, fielder’s choice, dropped third strike and reach on an error.
To qualify for the batting title, you must have 502 at-bats. The five other times at the plate are not even considered for this prestigious award. All at-bats are not created equal. If a batter hits a weak grounder in front of the plate and beats it out, is that the same quality at-bat as when hitting a grand slam? No it is not. Something is wrong in the numbers. I read a story that fits my thoughts on this and I will attempt to paraphrase it into baseball terms.
There was a Girl Scout troop selling cookies and the scout leader gave one girl the spot by the muffler shop where the smells around it were rather putrid at most times. SHe gave another girl a spot just outside the pizza shop where the smells were good most of the time. Which one is more likely to sell more cookies? The one outside the pizza joint.
So how does that apply to baseball and RBI’s? It ‘s all about location. Which is the same that can be said for where a player is located in the batting order. The players that bat near Mike Trout are likely to get more runs batted in than the ones near Jack Lopez. Everything is not equal.
The Godfather of Sabermetrics
Bill James
Bill James is known as the father of sabermetrics! He grew up a Royals fan and began thinking about how batting average has flaws in it and he developed a new system including many of the game outcomes that are not official at-bats. It became very popular. In fact, it was the impetus for the movie Moneyball.
James was hired by the Boston Red Sox to work in their statistical department and he did that for 17 years. He has written dozens of books on the subject and is generally regarded as the leader or father of the sabermetrics movement. His website, Bill James Online is here.
Pete Palmer
Pete Palmer first got noticed in 1982 when he found an error in Ty Cobb’s batting average of 1910 that had been created in the American League office. But he was working with baseball statistics well before that. He had a full time job working at Raytheon Corporation but was compiling baseball statistics in his spare time. He developed the first known comprehensive Sabermetrics database. In the 1970s, Palmer edited Turkin and Thompson’s Official Encyclopedia of Baseball, first published in 1951. By 1989, Palmer and Thorn collaborated to produce Total Baseball.
Earnshaw Cook
Earnshaw Cook started out with the project of proving that Ty Cobb was a better player than Babe Ruth through the use of advanced metrics, This was in 1962. He published the culmination of his work, Percentage Baseball (MIT Press), in 1964. Percentage Baseball was the first book of baseball statistics studies to gain national media attention.
Sabermetric for Hitters
There are a multitude of sabermetric stats that are related to the offensive side of the game. Let’s look at many of them and see what they mean and how it applies to the major league game.
wOBA = weighted on-base average
The weighted part of this equation is that every time on base is not equal to the other. (a double is worth more than a single etc.). The 2023 top three in the major leagues were Shohei Ohtani at ,433. Ronald Acuna Jr. was .428 and Corey Seager finished at .419.
The formula changes almost every year. This was the 2023 formula:
- wOBA = (.69 x uBB + .719 x HBP + .874 x 1B + 1.232 x 2B + 1.554 x 3B + 1.986 x HR) ÷ (AB + BB – IBB + SF + HBP)
OBP = On-base percentage
OBP measures the frequency a batter reaches base. The league average for on-base percentage has varied considerably over time; in the modern era it is around .340, whereas it was typically only .300 in the dead-ball era. In 2023, Ronald Acuna Jr. led the majors with a .416 OBP followed by Ohtani at .412 and Freedie Freeman with a .410 OBP finished third.
On base percentage is calculated using this formula:
- OBP = (Hits + Walks + Hit by Pitch) ÷ (At Bats + Walks + Hit by Pitch + Sacrifice Flies)
OPS = On-base plus slugging
OPS adds on-base percentage and slugging percentage to get one number that unites the two. It’s meant to combine how well a hitter can reach base, with how well he can hit for average and for power.
It is measured by On-base plus slugging (OPS) calculated as the sum of a player’s on-base percentage and slugging percentage.
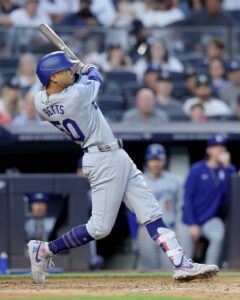
Mookie Betts led the major leagues with a 1.838 OPS in 2023, he was followed by Jake Cronenworth at 1.250. Third was Will Smith with a 1.145 average.
SLG = slugging percentage
SLG is a measure of the batting productivity of a hitter. It is calculated as total bases divided by at bats. Unlike batting average, slugging percentage gives more weight to extra-base hits with doubles, triples, and home runs, relative to singles.
In 2023, Shohei Ohtani led the majors with a .654 average. Cory Seager was second with .623 and Matt Olson was third at ,603.
ISO = isolated power
ISO is a sabermetric computation used to measure a batter’s raw power. One formula is slugging percentage minus batting average. The final result measures how many extra bases a player averages per at bat. A player who hits only singles would thus have an ISO of 0.
In 2023 season, Ohtani led all batters with a minimum of 100 games with an ISO of .350. Second in the major leagues was Aaron Judge at .346 and Matt Olson was .321 for third place.
WPA = Win Probability
WPA quantifies the percent change in a team’s chances of winning from one event to the next. It does so by measuring the importance of a given plate appearance in the context of the game. For instance: a homer in a one-run game is worth more than a homer in a blowout.
BABIP = Batting Average on Balls in Play
The rate at which the batter gets a hit when he puts the ball in play, calculated as (H-HR)/(AB-K-HR+SF).
wRC+ = Weighted Runs Created Plus
The most comprehensive rate statistic used to measure hitting performance because it takes into account the varying weights of each offensive action (like wOBA) and then adjusts them for the park and league context in which they took place.
BsR = Base Running Runs Above Average
Number of runs above or below average a player has been worth on the bases, based on stolen bases, caught stealing, extra bases taken, outs on the bases, and avoiding double plays. It is the combination of wSB, UBR, and wGDP.
WAR = Wins Above Replacement
A comprehensive statistic that estimates the number of wins a player has been worth to his team compared to a freely available player such as a minor league free agent. To calculate WAR:
- WAR = (Batting Runs + Base Running Runs + Fielding Runs + Positional Adjustment + League Adjustment +Replacement Runs) ÷ (Runs Per Win)
BATTER Contact%
Percent of swings resulting in fair contact
O-Contact%
Percentage of pitches swung at outside the zone that result in fair contact
Z-Contact%
Percentage of pitches swung at inside the zone that result in fair contact
Zone%
Percent of pitches in the strike zone
F-Strike%
Percentage of first pitches that are strikes
SwStr%
Percent of pitches resulting in swings and misses (different from whiff rate, which calculates the percentage of swings in which a batter whiffs)
Launch Angle
vertical angle at which the ball leaves a player’s bat after being struck. Average Launch Angle (aLA) is calculated by dividing the sum of all Launch Angles by all Batted Ball Events.
Exit Velocity
Measure the speed of the ball immediately as it comes off the bat.
NOTE: There are tons more offensive hitter sabermetrics numbers that can and will be used during a major league season. Many times, these newly created stats are used in negotiating contracts between the organization and the players agent.
Sabermetrics for Pitchers
Here are probably more sabermetric stats for pictures than any other aspect of the game. I will touch on some of them that are used most often.
Spin Rate
Describes how quickly a baseball rotates about an axis after it’s released. For example, the ball below has backspin and is rotating around the blue line. The spin rate would tell us how many revolutions the ball has around the line per minute.
WHIP = walks plus hits per inning pitched
WHIP is a sabermetric measurement of the number of baserunners a pitcher has allowed per inning pitched. WHIP reflects a pitcher’s propensity for allowing batters to reach base, therefore a lower WHIP indicates better performance.
In the 2023 season, Gerrit Cole led the major leagues with a 0.98 WHIP . Zach Eflin of the Rays was second at 1.02. Gorge Kirby and Kyle bradish tied at third with a very good 1.04.
FIP = Fielding Independent Pitching
FIP sort of works like the more common Earned Run Average (ERA), but FIP aims to measure what a pitcher’s ERA should look like if he were to experience league average results on balls in play. This statistic is calculated ((Home Runs x13)+(3xWalks+Hit by Pitches) – (2x strikeouts) / Innings pitched+FIP ConstantFIP constant can change from year to year based on the league’s run scoring environment, but traditionally it is 3.10.
In the 2023 baseball season, Sonny Gray led the major leagues with a 2,82 FIP while Spencer Strider was behind him with a 2.85. Finishing third was Kevin Gausmann at 2.87.
ERA = Earned run average
ERA represents the number of earned runs a pitcher allows per nine innings — with earned runs being any runs that are scored without the aid of an error or a passed ball. ERA is the most commonly accepted statistical tool for evaluating pitchers
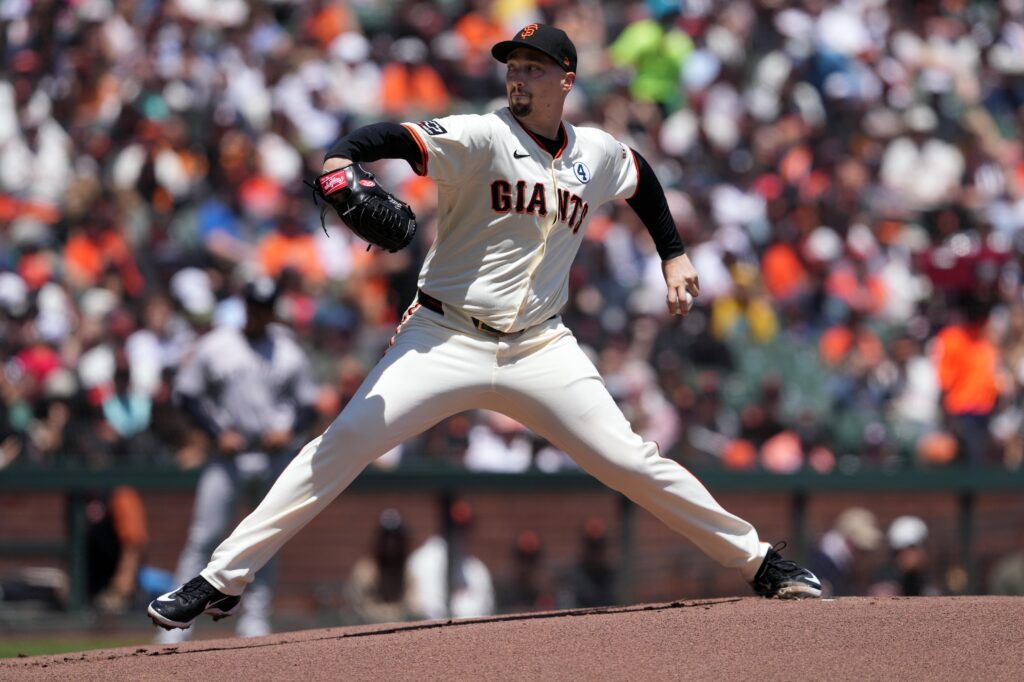
Blake Snell led the major league in ERA in 2023 with a 2.25 and Gerrit Cole was next with a 2,63. Sonny Gray finished third at 2.79.
ERA+
ERA+ Takes a player’s ERA and normalizes it across the entire league. It accounts for external factors like ballparks and opponents. It then adjusts, so a score of 100 is league average, and 150 is 50 percent better than the league average.
The same three pitchers. Snell,Cole and Gray led the majors with ERA+ from 154-182.
xFIP = Expected Fielding Independent Pitching
xFIP finds a pitcher’s FIP, but it uses projected home-run rate instead of actual home runs allowed. The home run rate is determined by that season’s league average HR/FB rate.
Spencer Strider of the Atlanta Braves came away with the best xFIP in the major leagues with a 2,85 and Sonny Gray followed at 2.83
SIERA = Skill Interactive ERA
SIERA answers what is the skill level of the pitcher? SIERA doesn’t ignore balls in play, but attempts to explain why certain pitchers are more successful at limiting hits and preventing runs. This is the strength of SIERA; while it is only slightly more predictive than xFIP, SIERA tells us more about the how and why of pitching.
GSc = Game Score
It measures a starting pitcher’s performance in a game.
To calculate this, start with 50 points. Add one point for each out recorded. Add two points for each inning complete after the fourth. Add one point for each strikeout. Subtract four points for each run allowed. Subtract two points for each unearned run allowed. Subtract one point for each walk.
In 1967, Bob Gibson received a game score of 80 in Game 7 of the World Series against Boston in Game 7. He pitched 9 innings with 10 strikeouts, allowed 3 hits, no earned runs and walked 3 batters…
The Calculation: 50+(1×27) + (2×5) + (1×10) – (2×3) – (4×2) – (2×0) – (1×3)
In other words: 50+27+10+10-6-8-0-3 = 80
Some Other Pitcher Sabermetric Terms
- FB% fly ball percentage. How is the pitcher characterized?
- LD% is the pitcher a line drive pitcher?
- GB% is the pitcher one that induces ground balls?
- IFFB%- to what rate does the pitcher get infield flies?
- K% it measured outcome that ends in strikeouts per 9 innings
- BB% it measures outcomes that end in a walk per 9 innings
- Exit Velocity Against- it measures how fast a ball is coming off the bat after pitched.
- LOB% Percentage of pitcher’s own base runners that they strand over the course of a season. Not equal to the LOB column in the box score.
- HR/FB- (Home Run to Fly Ball Rate): Percentage of a pitcher’s fly balls that go for home runs, calculated as HB/FB (even though some HR are line drives).
- WAR (Wins Above Replacement): A comprehensive statistic that estimates the number of wins a player has been worth to his team compared to a freely available player such as a minor league free agent based on FIP.
- K/9 – Average number of strikeouts per 9 innings
- BB/9– Average number of base on balls per 9 innings
- K% – Frequency with which the pitcher has struck out a batter, calculated as strikeouts divided by total batters faced
- BB% – Frequency with which a pitcher walks a batter divided by total batters faced.
- WPA (Win Probability Added): The total impact a pitcher’s batters faced (or SB/CS) have on his team’s win expectancy relative to league average.
- +WPA (Positive Win Probability Added) The sum of a pitcher’s positive WPA events
- RE24 – (Run Expectancy 24 Base Out State): The total impact a pitcher’s batters faced (or SB/CS) have on his team’s run expectancy relative to league average.
- WPA/LI – Situational Wins): A player’s WPA controlling for leverage index, calculated as the sum of each event’s WPA/LI, not total WPA/LI.
There are tons more that measure the pitcher. If you have a particular interest in some aspect, it is likely created already. We will continue to add to this list as time goes on.
Sabermetrics in the Field
In general, fielding can be broken down into four terms and they are positioning, range, hands and arm.
Positioning
This is difficult to quantify as was aren’t involved in the outing reports as to where a player should\d be positioned. We basically know that good positioning makes plays look easier and bad positioning will cause issues on getting a better out.
Range
Range is when we determine how far or near a player can successfully field their position. More range allows the defender to get to more batted balls.
Hands
Hands are more important in the infield as you have to transfer and catch the ball along with making tags as the outfield is just catching the ball.
Arm
Arms are important. We likely can remember some defender gunning down a base runner with an electric arm. Back in the late 60’s it was said runners did not try to take extra bases on right fielder Roberto Clemente as he would gun them down.
Some Common Fielding Sabermetrics
- Outs Above Average (range): 1 out = .9 run (OF) // 1 out = .75 run (IF)
- Fielder Throwing Runs: 1 run = 1 run
- Catcher Blocking: 1 block saved= .25 run
- Catcher Framing: 1 strike saved = .125 run
- Catcher Throwing: 1 SB prevented = .65 run
- Pop Time represents the time elapsed from the moment the pitch hits the catcher’s mitt to the moment the intended fielder is projected to receive his throw at the center of the base.
- Catch Probability- number that can be applied to every tracked batted ball to the outfield, and it’s on a scale of 0-100 percent, where a zero percent Catch Probability is “that ball is never, ever caught” and a 100 percent Catch Probability is “caught by everyone, always.”
Sabermetrics in Team Strategy
Up to this point, I have only given individual stats and there are others that should be addressed. That would be a team concept. Sabermetrics didn’t leave out those. Let’s take a look at a few, there aren’t many.
Magic Number
The “magic number” is used to determine how close a team is to making the playoffs or winning the division. It becomes prominent every year in September as teams begin closing in on clinching.
A team’s magic number represents the combination of wins needed by that team and losses by its closest competitor to clinch a given goal. Every time a team wins, its magic number decreases by one. Similarly, every time that team’s closest competitor for the division (or Wild Card) loses, the magic number also decreases by one.
Win Expectancy
Win Expectancy (WE), otherwise known as Win Probability, indicates the chance a team has to win a particular game at a specific point in that game.
Expressed as a percentage, Win Expectancy is calculated by comparing the current game situation — with the score, inning, number of outs, men on base and run environment all considered — to similar historical situations. More specifically, the percentage is derived from the number of teams that faced a comparable situation in the past and went on to win the game.
Pythagorean Winning percentage
Pythagorean winning percentage is a formula developed by renowned statistician Bill James. The concept strives to determine the number of games that a team *should* have won — based its total number of runs scored versus its number of runs allowed — in an effort to better forecast that team’s future outlook.
The initial formula for pythagorean winning percentage was as follows:
- (runs scored ^ 2) / [(runs scored ^ 2) + (runs allowed ^ 2)]
That formula proved more predictive than basic winning percentage when trying to predict a team’s future performance, although in the years since pythagorean winning percentage was popularized, other analysts have attempted to find an even more accurate formula.
Sabermetrics & the Business of Baseball
The use of advanced statistical analysis methods to best evaluate the capability for any business or corporation is a key component in success. The same kind of numbers are used but they just use “metrics” as the saber part is explicit to baseball.
In the business world, they refer to it as data mining. Data mining is most commonly defined as the process of using computers and automation to search large sets of data for patterns and trends, turning those findings into business insights and predictions.
That isn’t too far from the objective of sabermetrics.
Sabermetrics, the business, rose when immortalized in ‘Moneyball,’ and it inspired a generation of baseball fans and scouts to think differently about the game.In fact,sabermetrics has changed the way baseball is shouted. In the earlier days, scouts used the eye-ball test and gut feeling about how good or bad a player was. That has now fundamentally changed into using calculations and computers to analyze data. Scouts don’t need to attend games as they can get the numbers from box scores or coaches and have a read on each player. The analysis takes out all human elements of scouting.
What they can reap from this is a player with a lower batting average but a higher on-base percentage might be more valuable than a player with a higher batting average but fewer walks. This is because the player with the higher on-base rate is reaching base more often, thus creating more opportunities for his team to score.
The major differences in today’s scouting, as the landscape of baseball changes around it, are seen team-to-team, in the way scouting departments are structured and the way scouts are deployed. The way a scout evaluates an individual player is relatively uniform compared to other scouts. The ways teams evaluate the global pool of baseball players compared to other teams is often not. Now we have every team evaluates every player in its organization every year by the use of advanced analytics.
So how many people are in the analytics departments for each team? The latest numbers I could find came from the 2022 season and they look like this:
| Team | Employees | Spending (in millions) |
|---|---|---|
| Oakland | 8 | 49 |
| LA Angels | 15 | 182 |
| Houston Astros | 16 | 171 |
| Toronto | 15 | 174 |
| Atlanta Braves | 14 | 185 |
| Brewers | 18 | 132 |
| Cardinals | 13 | 158 |
| Chicago Cubs | 21 | 146 |
| Diamondbacks | 20 | 93 |
| Dodgers | 29 | 285 |
| Giants | 21 | 158 |
| Cleveland | 12 | 60 |
| Mariners | 17 | 105 |
| Miami Marlins | 9 | 80 |
| NY Mets | 26 | 266 |
| Nationals | 12 | 135 |
| Orioles | 19 | 58 |
| Padres | 15 | 212 |
| Phillies | 27 | 224 |
| Pirates | 14 | 62 |
| Rangers | 10 | 152 |
| Rays | 37 | 84 |
| Reds | 7 | 113 |
| Red Sox | 18 | 212 |
| Rockies | 5 | 133 |
| Royals | 10 | 95 |
| Tigers | 7 | 130 |
| Twins | 8 | 137 |
| White Sox | 5 | 190 |
| Yankees | Unknown | 237 |
Looking at the money spent by each team, it appears that those teams that spent the most money had a strong correlation to success.There is a good article from Sports Illustrated about traditional scouts looking for work with the success of analytics.
Sabermetric Resources
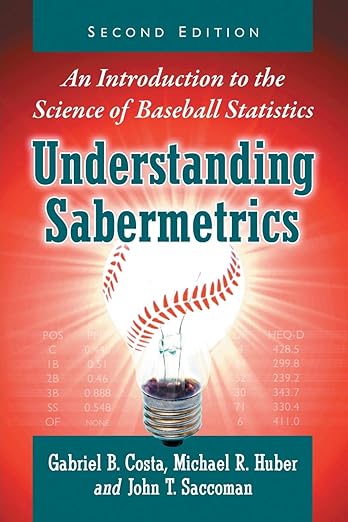
BEST SABERMETRIC BOOKS

MOVIES ABOUT SABERMETRICS
Oakland A’s general manager Billy Beane’s successful attempt to assemble a baseball team on a lean budget by employing computer-generated analysis to acquire new players.

WEBSITES
- Baseball Savant – charts. Graphs and new numbers on many players
- FanGraphs – analysis, graphs to prove their point
- Beyond the Boxscore – just what is says. They look at the numbers and throw a twist into it
- Baseball Prospectus – numbers driven and future analysis
- Fielding Bible – A place you can check fielding statistics
- MLB Park Factors – How each park plays differently
- Brooks Baseball – The original home of Pitchf/x
Sabermetrics Today
Today, the above books, movies and websites are available but there is a community of sabermetricians in almost every large city in the United States. They all are under the umbrella of The Society of American Baseball Research
Here you will find the average American with their sleeves rolled up working on some aspect of their research. You can be a certified member by joining and this gets you to a local group near you.
Check out their history page here. When you join, they have many free ebooks to send to you and their biography section has over 6000 ready for you to peruse.
Every year they have several conventions that you can be part of by registration. These are very worthwhile eventss
You can even take a class from Boston University. I took it and it was a moderate amount of work.
Current authors and TV personalities that deal in sabermetrics include:
- Bill James
- Billy Beane
- Greg Amsinger
- Brian Kenney
- John Smoltz
- Keith Costas
Tools of Sabermetrics
PECOTA – an acronym for Player Empirical Comparison and Optimization Test Algorithm, is a sabermetric system for forecasting Major League Baseball player performance. The word is a backronym based on the name of journeyman major league player Bill Pecota, who, with a lifetime batting average of .249.
Pitchf/x – tools to analyze start-by-start of each pitcher.
Statcast- is tracking and quantifying much of the action on the field. That applies to pitching (velocity, spin rate and direction, movement),and hitting
Each club now has 12 Hawk-Eye cameras arrayed around its ballpark. Five of those, which have higher frames-per-second rates, focus on pitch tracking. The other seven are dedicated to tracking players and batted balls. This more robust system has raised the percentage of batted balls that get tracked from roughly 89% to 99%.
The Importance of Sabermetrics
There are some that will tell you it is garbage. I am not here to argue that. It took me many years to get on board. It’s like everything in society that is changing. We can get aboard or left behind. There is a definite argument for the old stats may not be as valuable as they were thought to be.
Sabermetrics has improved baseball and allowed clubs and fans to see an improvement in baseball quality. Things with the explosion that computers and AI have brought to all aspects of our lives, did not leave baseball untouched.
The Future of Sabermetrics
If I could read the future I would be a genius making lots of money but my thoughts on this say that it will continue to explode and someday they will be able to predict performance by the exact temperature and wind conditions outside to the most minute detail. It is here more than many lifetimes so latch on and embrace it.
It was in the early 1980’s that the term sabermetrics made its way into the mainstream of baseball vocabulary. However, baseball statistics have been around since the inception in the 1845 season and later with Henry Chadwick. These numbers have always been used by the management of the major league teams to evaluate players.
Now the sabermetric language is still relatively new and the older generations are not buying into them rapidly. With sabermetrics, teams can now forecast results by making predictions based on previous data analyze on-field performance by recording and evaluating important aspects of playassist in decision-making by offering objective insights into players’ performance, matchups, and scouting prospects.
Last Fact Checked on June 12, 2024 by Ryan Knuppel